What do last month’s 2014 Hackney local election results reveal?
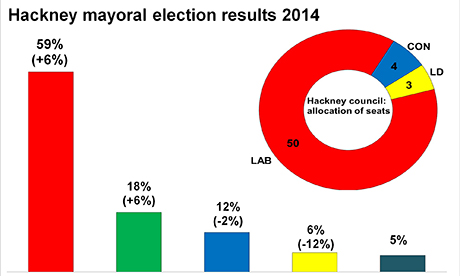
Chart showing the percentage of votes won by mayoral candidates and representation on the council achieved by each party. Image: Davide Tiberti
Jules Pipe and the Labour Party have recorded their biggest electoral victory since the post of Mayor of Hackney was introduced in 2002.
Pipe won 59 per cent of the vote (up eight per cent from 2010 and 20 per cent since 2002) with his party garnering 88 per cent of council seats.
Green Party candidate Mischa Borris came second in the mayoral contest with 18 per cent of the total votes, overtaking both the Liberal Democrats and Conservatives from 2010.
Linda Kelly, the Conservatives’ mayoral candidate, finished third (12 per cent) while the Liberal Democrats with Simon de Deney lost significant ground (down 12 per cent from 2010) and slipped into fourth place in front of independent candidate Mustafa Korel (five per cent).
Despite the ward boundary review in 2012, the distribution of seats in the council has hardly changed as Labour won 50 seats, the Conservative Party four (three in Springfield and one in the new ward of Stamford Hill West) and the Liberal Democrats retained their three seats in Cazenove.
Turnout
Turnout for the mayoral election was 40 per cent; lower than in 2010 – when it was combined with the UK Parliament elections, which is when turnout is at its highest.
However, turnout was significantly better than in 2006 and 2002. Turnout was highest in the northern wards of Cazenove, Clissold and Springfield and lower in ‘trendy’ areas like Dalston, Hoxton East, Hoxton West and Haggerston.
This is likely to be due to the demographics of these wards as the ones with lower turnout have a younger, more transient population, generally less likely to vote and less likely to be on the electoral register.
Higher turnout is linked to a lower concentration of young people and possibly marginality as Cazenove, where the Lib Dems won by two per cent, recorded the highest turnout – 49 per cent.
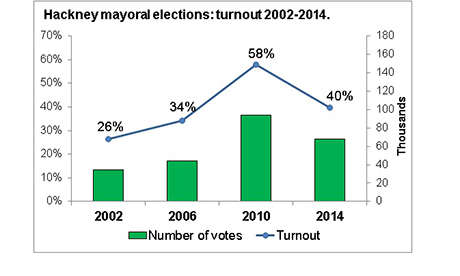
Chart showing turnout at last month’s election. Image: Davide Tiberti
European elections
Hackney was also voting to elect the London representatives in the European Parliament last month.
Labour came first with 54 per cent of the vote, followed by the Greens (18 per cent), the Conservatives with 11 per cent and the Lib Dems (six per cent). As was the case in the rest of the capital, UKIP did not perform as well as in Great Britain as a whole (five per cent as against 27 per cent nationally).
Turnout was 42 per cent, higher than in other parts of London and the UK.
Davide Tiberti is a Senior Researcher at The Electoral Commission