Leaflet watch: Just how accurate is Clissold Liberal Democrats’ ‘others can’t win’ claim?
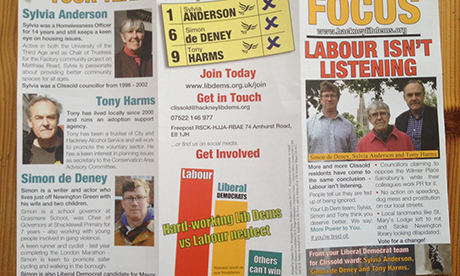
Best bar none?: The Liberal Democrats’ ‘not mathematically based’ bar chart appears at the bottom of their Clissold ward election leaflet
It’s not the first time and it almost certainly won’t be the last that a bar chart on a Liberal Democrat election leaflet has raised eyebrows.
The Lib Dems’ election leaflet telling residents why they should vote for the party’s Clissold ward candidates – Simon de Deney, Tony Harms and Sylvia Anderson – includes a graph purporting to show the party is the only one other than Labour that can win here.
This is Clissold ward we are talking about, remember – the same Clissold ward where the Greens traditionally do rather well.
Well, not quite the same, Lib Dem organiser Ben Mathis points out – and admittedly the ward boundaries have shifted since the last local elections, meaning a certain amount of uncertainty.
Still, Mathis does concede the chart may be a little over-the-top.
“It’s not the most mathematically-based bar chart I have ever done,” he told the Hackney Citizen. “But what I would say is that the people who are objecting to it are not arguing about the main part of the leaflet showing all the work our candidates have done.”
Green Member of the European Parliament Jean Lambert agreed that the leaflet was “cheeky”.
But the strongest words on the Lib Dem leaflet have perhaps surprisingly come not from the Greens but from Labour.
“At least the Greens put on the old 2010 result for the old boundaries (with a zero axis),” said Labour Party organiser Tom Dewey. “There is an even better Tory one from Dudley doing the rounds, possibly the only thing the Lib Dems have influenced their coalition partners on is how to do the fabled dodgy bar chart!”